There are some great things happening in Island schools and we know that there are plenty of passionate teachers at Island schools who are doing their best, every day, to bring the best education to Isle of Wight pupils.
With the latest set of confirmed GCSE results, all but one of the Island’s schools have show improvements in their results.
Researching the full story
To get a full picture of where we have come from OnTheWight has been working for some time with Isle of Wight council (they’ve been very helpful) to compile the details of all of the GCSE results across the Island schools dating back to when full records are available. Going back to 2006 also shows trends over that time.
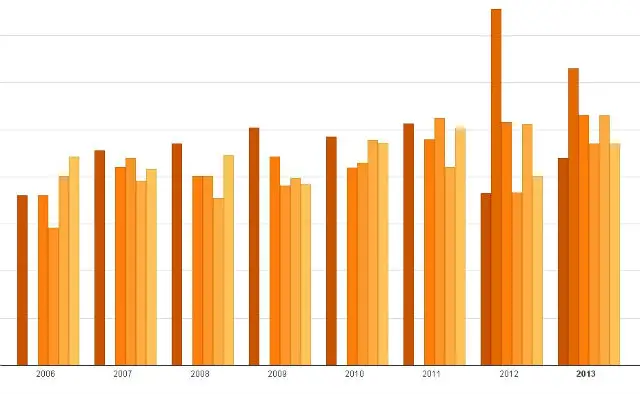
Often graphs can instantly show detail/trends that perhaps take longer to come out when looking at just the numbers. For that reason, we compiled a number of graphics we hope you’ll find useful.
While all of us on the Isle of Wight know that the schools were reorganised from three tier to two tier in 2011, and their legal status changes, the schools are essentially the same, so we’ve put together the results in one table.
5+ A*-C GCSEs
All of these stats are based on the widely-accepted measurement of performance – % achieving 5+ A*-C GCSEs (or equivalent) including English and maths. For brevity, we’ll just refer to them as ‘the results’.
We do include one table of numbers. It’s done in a way that you are able to reorder the results, simply click on the year that you are interested in. The tables will re-order to show the highest or lowest first, denoted by the arrowhead to the right of the column title.
Clicking on the light grey box of arrows will expand the graph or table to be full screen, which might be of particular value on tightly-packed graphs like ‘IW School GCSE performance 2006-2013’.
IW School GCSE performance 2006-2013
Focusing on the results over the last two years, the graph makes clear that Medina and Sandown Bay have had a strong improvement 2012-13 and Carisbrooke is also showing an improvement.
Christ the King has come off a little from its very high entry in 2012. (It’s worth mentioning that Christ the King was newly-formed as a Senior school, so the 2012 results were their first.)
The underlying data for the graph is in the table underneath. Use the scroll bar under the table to see the most recent data.
Large gap between the Island and the rest of England
As Island residents are all to aware, the Isle of Wight schools do not measure up well against the standard of schools across the England.
This has led to incidents of great embarrassment to the Island, the most resent being when Ofsted’s chief inspector, Sir Michael Wilshaw, used the Island as his example of a ‘two nations’ gap in school standards, highlighting that only 14% of secondary pupils on the Isle of Wight are going to a ‘Good’ school, that being the worst in the England.
We’ve created two charts to help understand the gap in GCSE performance.
Average GCSE results – IW vs England
This shows the rising results across England and the Isle of Wight. It also shows the gap between the two. As the size of that gap is hard to judge precisely, we created another graph, below, to detail that.
Gap between IW GCSE results and rest of England
The chart below shows the difference between the results achieved, averaged across all Island state-funded schools, against those averaged across the state-funded schools of England.
It shows that while there has been a slight improvement – 10% lower in 2012 vs 9.4% lower in 2013 – the gap remains substantial.
There are some notable highlights – 2007 was the year the Island was most close to the rest of the UK, with the gap closing to only 3.6% lower.
What the graph clearly reveals is that since then, things have got worse.
Building a better education
Let’s hope that the improvements that are being made multiply, so we can start to close the gap with the Mainland, moving to a position where the Island school’s are better than those on the Big Island.


