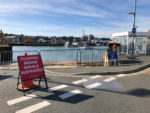
As reported comprehensively by News OnTheWight yesterday (Thursday), the Cowes Floating Bridge not operating as expected has caused huge losses over the past 26 months.
After examining the Isle of Wight council’s (IWC) response to a detailed Freedom of Information request made by the Floating Bridge Stakeholders’ and Engineers’ Group, News OnTheWight were able to share with readers details that over £1m has been paid to Private Contractors and ‘Professional Services’, as well as FB6 being out of service September alone leading to a loss of nearly £100,000.
Income for last 26 months
Throughout the FB6 fiasco, when it’s been running, the Bridge has been responsible for decent income levels, as detailed below. However, it’s not been enough to cover the losses, and certainly not at the level that was expected – see further down for details of forecasting when FB6 was just a twinkle in the eye of the IWC.
When looking at the figures below, remember that during late March to end of June 2020, most of the country was in lockdown and passenger numbers were way down, with the Floating Bridge running just for keyworkers, so it’s understandable that income levels dropped.
It’s also worth noting …
It’s also worth noting that this data below runs from August 2018 to July 2020 and doesn’t include the extra two months that the other figures included.
The last column shows if the 2019/20 month was an increase or decrease in ticket takings.
| 2018/19 | 2019/20 | Gain/loss | |
|---|---|---|---|
| Aug | £77,402 | £92,461 | £15,059 |
| Sep | £65,819 | £59,750 | -£6,069 |
| Oct | £59,998 | £46,154 | -£13,844 |
| Nov | £45,307 | £74,362 | £29,055 |
| Dec | £38,811 | £60,757 | £21,946 |
| Jan | £59,661 | £61,422 | £1,761 |
| Feb | £47,656 | £49,904 | £2,248 |
| Mar | £67,332 | £50,940 | -£16,392 |
| Apr | £52,870 | £6,496 | -£46,374 |
| May | £68,327 | £15,476 | -£52,851 |
| Jun | £72,865 | £32,395 | -£40,470 |
| Jul | £85,539 | £49,441 | -£36,098 |
Compared to FB5
Although income for FB6 over the past 26 months has been higher than its predecessor, Floating Bridge 5 (FB5), it is still much less than that forecasted by council officers, who had predicted the FB6 would be raking in over £1m per annum.
Of course, there is the added bonus of an increase in fares, as well as the introduction in June 2015 of pedestrian fares.
Below shows the income totals for the last eight years and IWC officers’ forecasts if known.
| Year | Cost | Forecasted |
|---|---|---|
| 2012-13 | £674,000 | Unknown |
| 2013-14 | £646,000 | Unknown |
| 2014-15 | £656,000 | Unknown |
| 2015-16 | £709,000 | Unknown |
| 2016-17 | £731,000 | Unknown |
| 2017-18 | £402,916 | £1,011,000 |
| 2018-19 | £738,513 | £875,100 |
| 2019-20 | £775,351 | Unknown |
More on the way
News OnTheWight still has more articles to come from the FOI data which we plan to publish over the rest of day, so check back here to dig into the story in the Deep Dive Series.
If you like stories like this sign up for our daily email newsletter.
Image: howardlake under CC BY 2.0


