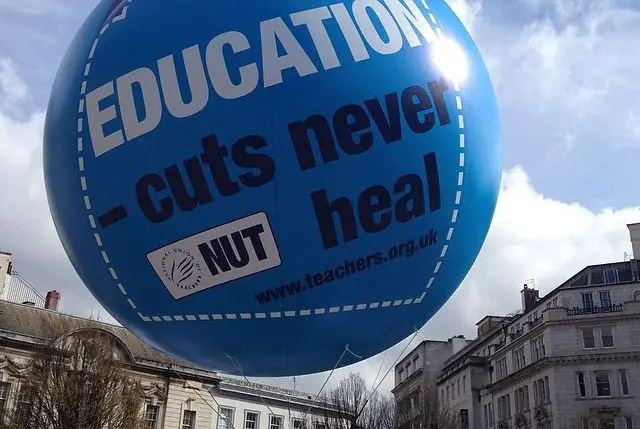
Peter Shreeve, Isle of Wight Branch Secretary for the Association of Teachers and Lecturers Section, National Education Union, shares this latest news. Ed
Following the recent announcement on school funding by Justine Greening, the picture remains bleak.
Based on the latest government figures, we estimate 38 of 40 Isle Of Wight schools will face cuts:
- This equates to a total loss of -£3.4M by 2020 which is an average -£252 per-pupil loss
- Or 72 teachers lost
- Nationally 88% of schools are still facing real-terms budget cuts per pupil between 2015/16 and 2019/20
- For the average primary school this will be a loss of £52,546 per year
- For the average secondary school this will be a loss of £178,321 per year
As a result of the campaign by parents, trade unions, teachers, heads and support staff to ensure our schools are properly funded, the Government has found £1.3bn over the next two years from other parts of the Department for Education’s budget.
This, while important, is nowhere near enough to reverse the £2.8bn in cuts that schools have suffered since 2015.
Latest figures
The School Cuts Website – has been updated to reflect the Government’s latest figures on school funding. Don’t let the Government pull the wool over your eyes.
Head over to the School Cuts Website, put in your postcode and see exactly how badly schools in your area will be affected.
Still not enough funding for schools
Peter Shreeve, Joint Branch Secretary of the new National Education Union (NEU), said:
“The bottom line is that the Government has still not found enough funding for schools. The cuts schools are already having to make are only going to get worse, with most schools being faced with cutting subjects, increasing class sizes, cutting staffing, reducing the support for vulnerable children and providing a less rounded education for pupils.
“What is more, parents know that behind every teacher is a whole team helping schools run smoothly, allowing teaching staff to concentrate on teaching.
“These cuts are almost certain to include some support staff. When support staff are cut, their tasks are either not completed or they fall to teachers. Pupils are undoubtedly the losers.”
The stats
Full details of changes to funding per pupil and per school can be found in the table below. Readers can sort the table by clicking on the arrows at the top of each column.
School | Pupils | Change 2015/16 - 2019/20 | Change per pupil 2015/16 - 2019/20 | Percent change 2015/16 - 2019/20 | Teacher Change 2015/16 - 2019/20 | |||||||||
---|---|---|---|---|---|---|---|---|---|---|---|---|---|---|
All Saints CE Primary | 96 | -£36,359 | -£379 | -8% | -1 | |||||||||
Arreton St George's CE Primary | 184 | -£59,045 | -£321 | -8% | -1 | |||||||||
Brading CE Primary | 102 | -£23,564 | -£231 | -4% | -1 | |||||||||
Barton Primary School and Early Years Centre | 221 | -£39,811 | -£180 | -4% | -1 | |||||||||
Bembridge C of E Primary | 193 | -£27,971 | -£144 | -4% | -1 | |||||||||
Binstead Primary | 210 | -£37,320 | -£177 | -5% | -1 | |||||||||
Brighstone CE Primary | 136 | -£2,511 | -£18 | 0% | 0 | |||||||||
Broadlea Primary School | 380 | -£80,900 | -£212 | -5% | -2 | |||||||||
Carisbrooke C of E Primary | 390 | -£110,263 | -£282 | -7% | -3 | |||||||||
Carisbrooke College | 615 | -£17,7836 | -£289 | -5% | -4 | |||||||||
Chillerton and Rookley Primary School | 82 | -£46,529 | -£567 | -11% | -1 | |||||||||
Christ The King College | 1,255 | -£29,0966 | -£231 | -5% | -6 | |||||||||
Cowes Enterprise College | 889 | -£97,937 | -£110 | -2% | -2 | |||||||||
Cowes Primary | 295 | -£79,996 | -£271 | -7% | -2 | |||||||||
Dover Park Primary | 206 | -£8,958 | -£43 | -1% | 0 | |||||||||
Gatten and Lake County Primary | 196 | -£87,618 | -£447 | -9% | -2 | |||||||||
Godshill Primary | 137 | -£47,503 | -£346 | -8% | -1 | |||||||||
Greenmount Primary | 370 | -£113,215 | -£305 | -7% | -3 | |||||||||
Gurnard Primary | 375 | -£85,291 | -£227 | -6% | -2 | |||||||||
Haylands Primary | 392 | -£73,555 | -£187 | -5% | -2 | |||||||||
Holy Cross Catholic Primary School | 205 | -£56,918 | -£277 | -7% | -1 | |||||||||
Hunnyhill Primary | 332 | -£142,657 | -£429 | -10% | -3 | |||||||||
Isle of Wight Studio School | 121 | £79,794 | £659 | 11% | 1 | |||||||||
Lanesend Primary School | 349 | -£174,353 | -£499 | -11% | -4 | |||||||||
Medina College | 947 | -£175,856 | -£185 | -3% | -4 | |||||||||
Nettlestone Primary | 198 | -£61,846 | -£312 | -8% | -1 | |||||||||
Newchurch Primary | 216 | -£48,119 | -£222 | -6% | -1 | |||||||||
Newport C of E Primary School | 304 | -£23,399 | -£76 | -2% | -1 | |||||||||
Nine Acres Primary | 359 | -£46,256 | -£128 | -3% | -1 | |||||||||
Niton Primary | 161 | -£47,647 | -£295 | -7% | -1 | |||||||||
Northwood Primary School | 189 | -£14,408 | -£76 | -2% | 0 | |||||||||
Oakfield C of E Primary | 293 | -£163,723 | -£558 | -11% | -4 | |||||||||
Queensgate Foundation Primary | 390 | -£41,582 | -£106 | -3% | -1 | |||||||||
Ryde Academy | 894 | -£223,627 | -£250 | -5% | -5 | |||||||||
Sandown Bay Academy | 955 | £65,459 | £68 | 1% | 1 | |||||||||
Shalfleet | 167 | -£66,848 | -£400 | -9% | -1 | |||||||||
St Blasius Shanklin CofE Primary Academy | 194 | -£34,599 | -£178 | -4% | -1 | |||||||||
St Francis Catholic and Church of England Primary School | 270 | -£85,539 | -£316 | -7% | -2 | |||||||||
St Helens Primary School | 91 | -£80,612 | -£885 | -16% | -2 | |||||||||
St Marys RC Primary | 207 | -£53,017 | -£256 | -6% | -1 | |||||||||
St Saviour's Catholic Primary | 136 | -£58,965 | -£433 | -10% | -1 | |||||||||
St Thomas of Canterbury Catholic Primary | 179 | -£50,769 | -£283 | -7% | -1 | |||||||||
Summerfields Primary | 199 | -£31,015 | -£155 | -4% | -1 | |||||||||
The Bay C of E Primary | 423 | -£120,452 | -£284 | -6% | -2 | |||||||||
Wootton Community Primary School | 195 | -£42,325 | -£217 | -5% | -1 | |||||||||
Wroxall Primary School | 165 | -£150,055 | -£909 | -18% | -4 | |||||||||
Yarmouth C of E Primary | 92 | -£56,492 | -£614 | -12% | -1 |