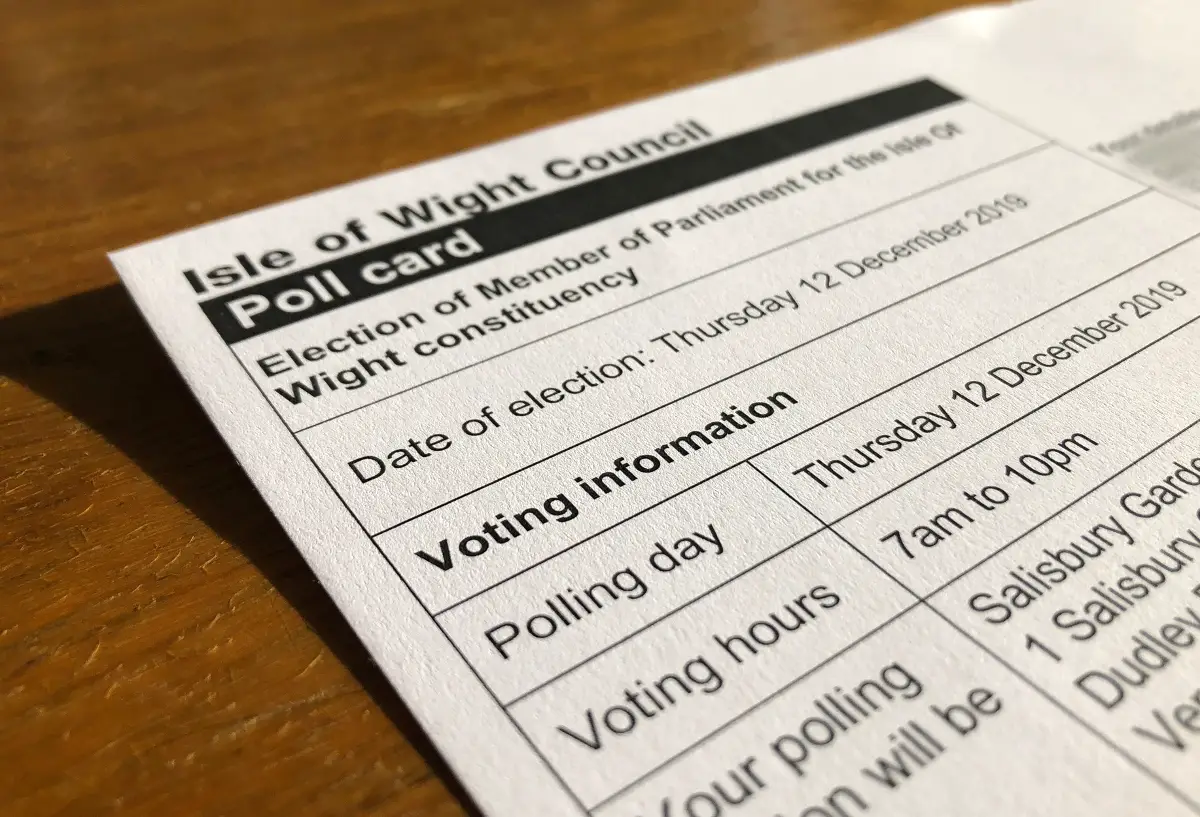
With just two weeks until the General Election – the fourth in less than ten years – we’ve seen a huge push on social media from many of the political parties to encourage citizens to register to vote.
In the 2017 election there were over 38,000 non-voters on the Isle of Wight.
Number of voter registrations
OnTheWight thought it would be interesting to see how many people had registered to vote from the beginning of September.
Between 1st September and midnight Tuesday (26th November) the council tell us there were 6,557 registrations in the Isle of Wight Council area.
An increase of 2,500
The total figure of eligible voters as of today stands at 113,136. That figure may change slightly
At the 2017 election the total number registered voters was 110,683. If the latest figures of those registered remains the same, the Island sees a boost of 2,453 voters.
In 2017, there was a 67.38% turnout at the election with 74,574 ballot papers issued, meaning 38,562 people who could have voted, didn’t.
95 people used their vote but spoiled their ballot paper.
Total eligible to vote might not change much
The council spokesperson explained that many of the 6,557 new registrations will be people who have moved from other addresses on the Island, some will be under 18s and some will be EU citizens.
They add,
“So the number eligible to vote at the General Election will not have increased by anything like that number.”
Under 25 year-olds
Keen to understand how many of those registrations were from under 25-year-olds, the Isle of Wight council say that they are unable to provide that detail.
A spokesperson told OnTheWight,
“Although we collect dates of birth at the point of registration, these are only used for initial verification of the elector’s identity, and do not form part of the register, and so they don’t appear in any reports or statistics, thus we are unable to give the proportion of under 25s.”


