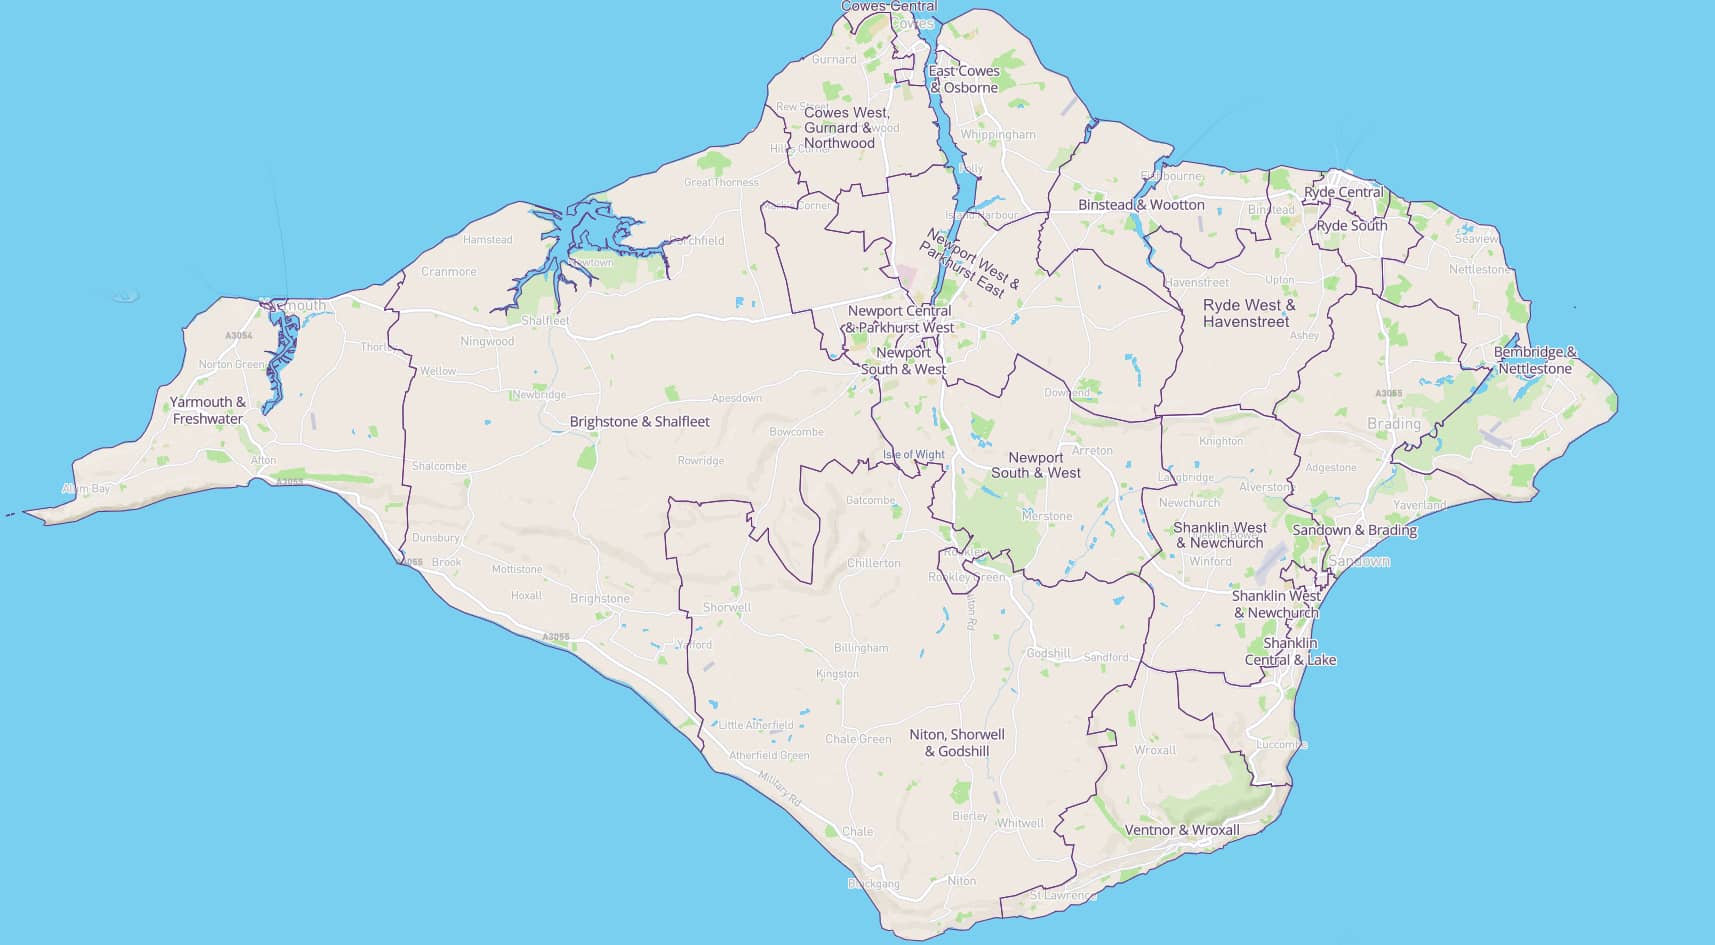
We thought it was worth looking deeper into the Isle of Wight’s current positive Covid tests data, by breaking the number down into the 18 different Island areas.
Rather than just looking at the biggest numbers, we’ve taken a different approach – looking at the number of positive Covid tests and comparing them against the official estimates of population size for the major Isle of Wight areas.
The following is gathered from the number of new positive tests in the week ending 18th August 2021.
We’ll look at the data in two ways: The change in number compared with the previous week, then in the second half, the weekly data.
First the changes.
Looking at changes
Yarmouth and Freshwater saw the largest increase in positive Covid tests both in size of increase when compared with the figures from 11th August 2021 (an increase of 29) and by change per 1,000 of the area’s population (3.1).
When considering the area’s population, the district whose position has moved the most is Brighstone and Shalfleet. Although they only had an increase of 12 positive tests in the week, because they have a small population (5,269 – getting on for only half of the largest population areas), it brought them up to the sixth highest rise, at 2.3 per thousand.
Reductions (change)
Cowes Central, Bembridge and Nettlestone, and Niton, Shorwell and Godshill all had reductions in the number of new positive tests from the previous week.
That said, they still had an additional 55, 15 and 19 positive Covid tests respectively.
| Change from prev wk | Change Per 1,000 of area pop. | |
|---|---|---|
| Cowes West, Gurnard & Northwood | 7 | 0.8 |
| Cowes Central | -2 | -0.3 |
| Yarmouth & Freshwater | 29 | 3.1 |
| Newport East & Parkhurst East | 13 | 1.5 |
| Binstead & Wootton | 10 | 1.5 |
| Shanklin Central & Lake | 27 | 3 |
| Ryde West & Havenstreet | 24 | 3.1 |
| Newport Central & Parkhurst West | 8 | 1 |
| Brighstone & Shalfleet | 12 | 2.3 |
| East Cowes & Osborne | 11 | 1.5 |
| Newport South & West | 20 | 2.1 |
| Shanklin West & Newchurch | 24 | 3 |
| Ryde Central | 15 | 2.3 |
| Ventnor & Wroxall | 7 | 0.9 |
| Niton, Shorwell & Godshill | -2 | -0.3 |
| Sandown & Brading | 13 | 1.4 |
| Ryde South | 2 | 0.2 |
| Bembridge & Nettlestone | -2 | -0.3 |
Positive test numbers
The top three areas with the largest number of positive Covid tests in the week ending 18th August 2021 are:
- Cowes West, Gurnard and Northwood (67);
- Cowes Central (55);
- Yarmouth and Freshwater (50)
These also remain the highest, when the size of their population is considered.
- Cowes West, Gurnard and Northwood (7.8 per 1,000);
- Cowes Central (7 per 1,000);
- Yarmouth and Freshwater (5.3 per 1,000)
Lowest
The three areas with the lowest number of new positive tests are:
- Bembridge and Nettlestone (15);
- Niton, Shorwell and Godshill (19);
- Ryde South (20)
This changes slightly when the population of the area is considered.
- Bembridge and Nettlestone (15 – 2 per 1,000);
- Ryde South (20 – 2.3 per 1k);
- Sandown and Brading (31 – 3.3 per 1k);
| Official est pop. | New positive tests w/e 18 Aug | Per 1,000 of area pop. | |
|---|---|---|---|
| Cowes West, Gurnard & Northwood | 8608 | 67 | 7.78 |
| Cowes Central | 7885 | 55 | 6.98 |
| Yarmouth & Freshwater | 9487 | 50 | 5.27 |
| Newport East & Parkhurst East | 8437 | 43 | 5.1 |
| Binstead & Wootton | 6782 | 34 | 5.01 |
| Shanklin Central & Lake | 8949 | 44 | 4.92 |
| Ryde West & Havenstreet | 7868 | 37 | 4.7 |
| Newport Central & Parkhurst West | 8133 | 37 | 4.55 |
| Brighstone & Shalfleet | 5269 | 22 | 4.18 |
| East Cowes & Osborne | 7434 | 31 | 4.17 |
| Newport South & West | 9618 | 39 | 4.05 |
| Shanklin West & Newchurch | 7906 | 31 | 3.92 |
| Ryde Central | 6468 | 24 | 3.71 |
| Ventnor & Wroxall | 7529 | 25 | 3.32 |
| Niton, Shorwell & Godshill | 5739 | 19 | 3.31 |
| Sandown & Brading | 9430 | 31 | 3.29 |
| Ryde South | 8769 | 20 | 2.28 |
| Bembridge & Nettlestone | 7460 | 15 | 2.01 |