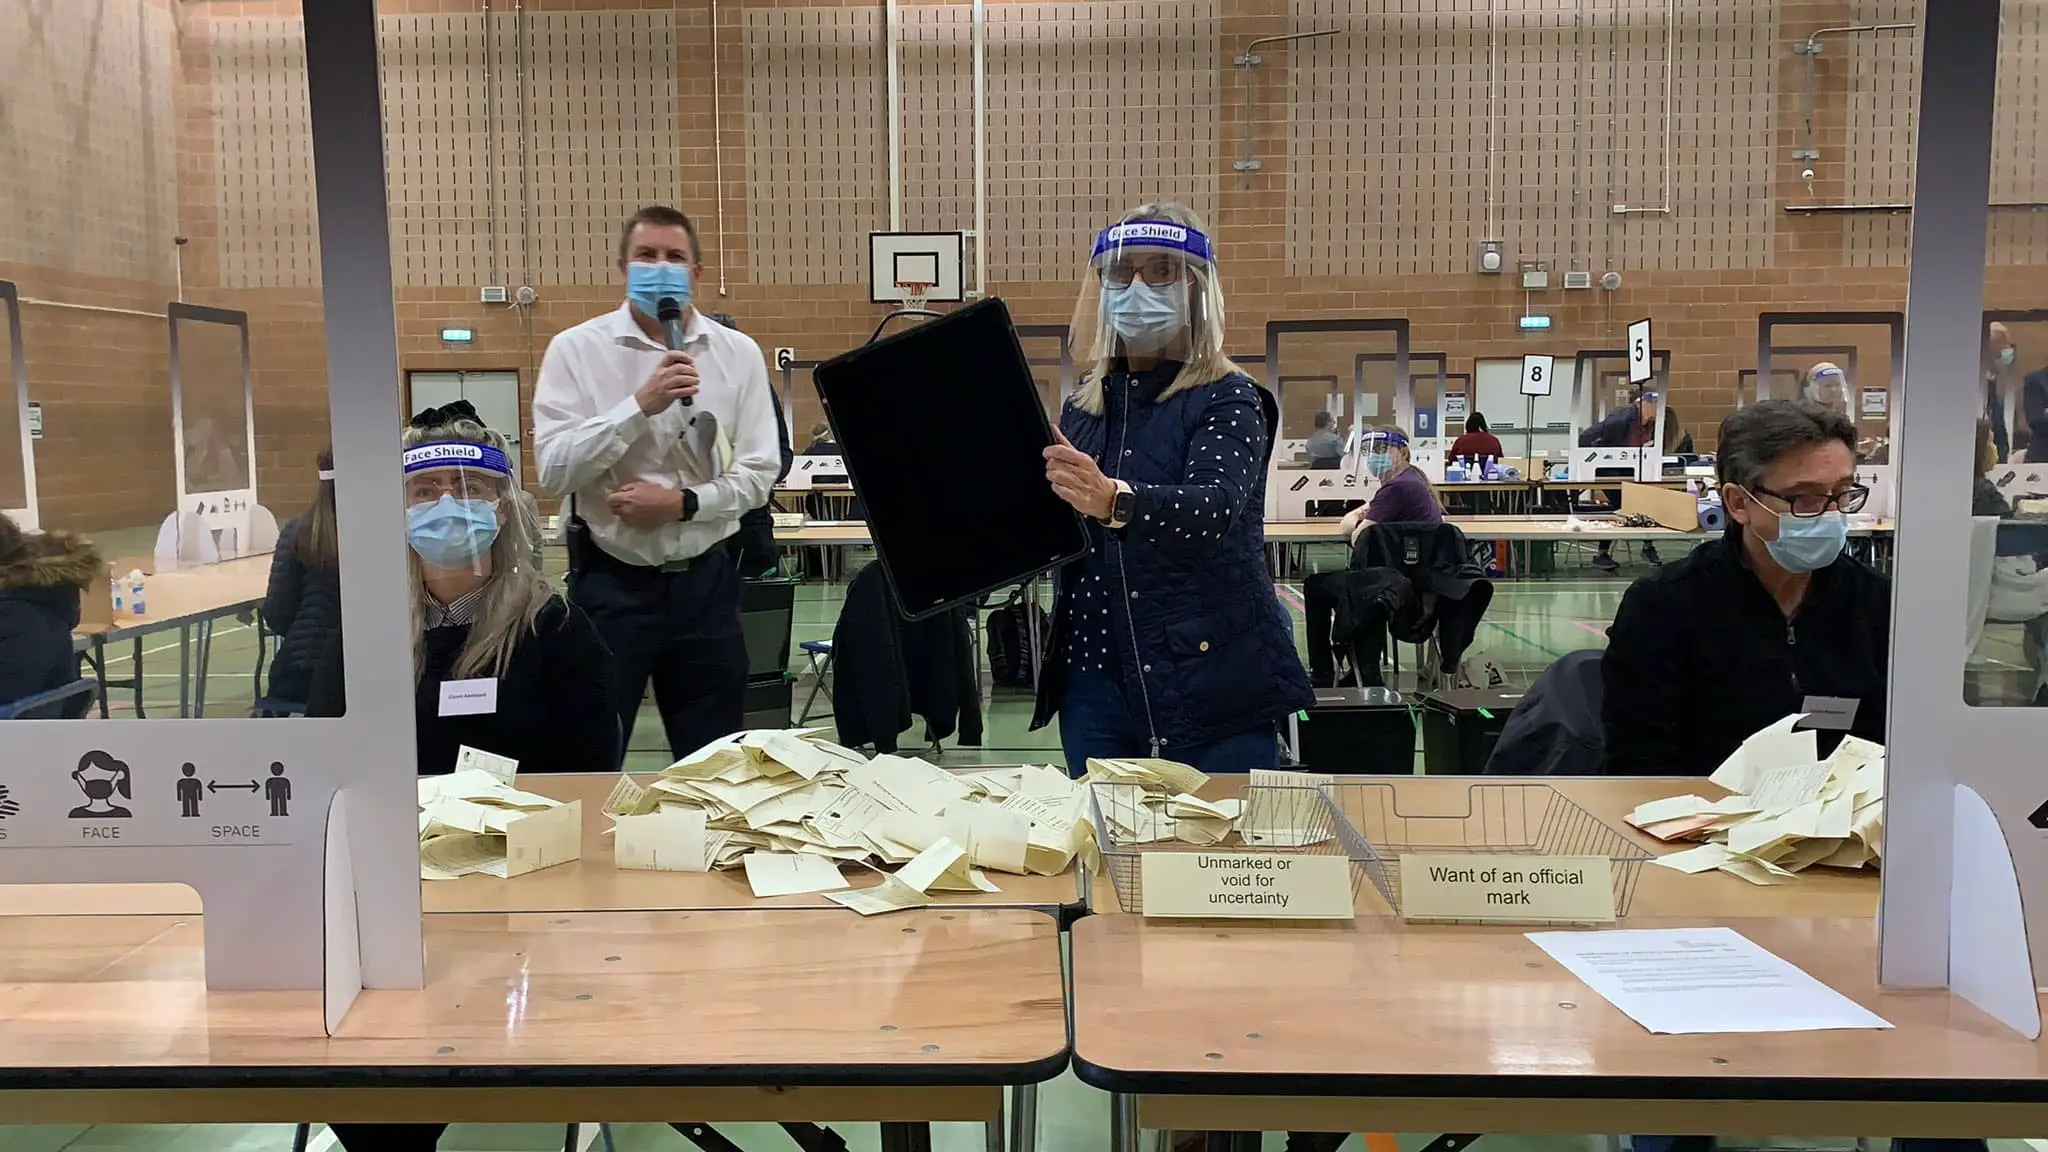
The election turnout figures for Isle of Wight council elections are often lower than those for Westminster.
2021 has generally proven no different. Below are the figures for each of the Island’s 39 wards, thanks to IW council who provided the information supplied.
There are a few of the wards worth picking out:
Highest
Chale, Niton and Shorwell for the size of its turnout. At 51.24 per cent it’s the highest turnout of the election. Notable, but all the more interesting as this is one of the seats that had the fewest number of people competing for the seat – two. Intrigue is added by it being the ward where the previous-Leader of the council, Dave Stewart, lost his seat.
At the other end of the spectrum was Ryde South East, which only got a turnout of 22.23 per cent. It also the ward with the smallest electorate, 1,750.
Largest ward
The largest ward by electorate is Bembridge at 3,216.
We’re sure you can find more interesting details by looking at the info below and re-sorting it in various ways.
Table info
To reduce the width of the table we’ve abbreviated Electorate (the number of people registered in a ward to vote), to ‘Elect.’ The next column ‘Issued’ is short for Ballot papers issued, the number of people who turned up at the polling station to vote.
| Ward | Elect. | Issued | Turnout |
|---|---|---|---|
| Bembridge | 3216 | 1391 | 43.25% |
| Binstead and Fishbourne | 2909 | 1288 | 44.28% |
| Brading and St Helens | 2784 | 1121 | 40.27% |
| Brighstone, Calbourne, Shalfleet | 2602 | 1269 | 48.77% |
| Carisbrooke and Gunville | 2731 | 956 | 35.01% |
| Central Rural | 2902 | 1083 | 37.32% |
| Chale, Niton and Shorwell | 2986 | 1530 | 51.24% |
| Cowes Medina | 3094 | 972 | 31.42% |
| Cowes North | 2826 | 1158 | 40.98% |
| Cowes South and Northwood | 2878 | 1148 | 39.89% |
| Cowes West and Gurnard | 2911 | 1429 | 49.09% |
| East Cowes | 3198 | 1343 | 41.99% |
| Fairlee and Whippingham | 2940 | 1044 | 35.51% |
| Freshwater North and Yarmouth | 2655 | 1100 | 41.43% |
| Freshwater South | 3115 | 1213 | 38.94% |
| Haylands and Swanmore | 2738 | 907 | 33.13% |
| Lake North | 2878 | 917 | 31.86% |
| Lake South | 2896 | 1074 | 37.09% |
| Mountjoy and Shide | 2757 | 828 | 30.03% |
| Nettlestone and Seaview | 2439 | 1150 | 47.15% |
| Newchurch, Havenstreet and Ashey | 2891 | 1187 | 41.06% |
| Newport Central | 2685 | 706 | 26.29% |
| Newport West | 2859 | 875 | 30.61% |
| Osborne | 3147 | 920 | 29.23% |
| Pan and Barton | 2832 | 674 | 23.80% |
| Parkhurst and Hunnyhill | 2748 | 759 | 27.62% |
| Ryde, Appley and Elmfield | 3069 | 1067 | 34.77% |
| Ryde Monktonmead | 3012 | 909 | 30.18% |
| Ryde North West | 3141 | 1097 | 34.93% |
| Ryde South East | 1750 | 389 | 22.23% |
| Ryde West | 2683 | 941 | 35.07% |
| Sandown North | 2707 | 948 | 35.02% |
| Sandown South | 2831 | 846 | 29.88% |
| Shanklin Central | 2887 | 1010 | 34.98% |
| Shanklin South | 3014 | 1084 | 35.97% |
| Totland and Colwell | 3140 | 1368 | 43.57% |
| Ventnor and St Lawrence | 3078 | 1231 | 39.99% |
| Wootton Bridge | 2859 | 1136 | 39.73% |
| Wroxall, Lowtherville and Bonchurch | 3097 | 1283 | 41.43% |
Image: © Louise Hill LDR


